Arizona’s current long-term drought among worst on record
PHOENIX (AZFamily) — It’s no secret that Arizona has been in long-term drought status for years. But how does this one compare historically?
The Arizona State Climate Office posted the graphic below on X this week regarding the long-term drought in Arizona.
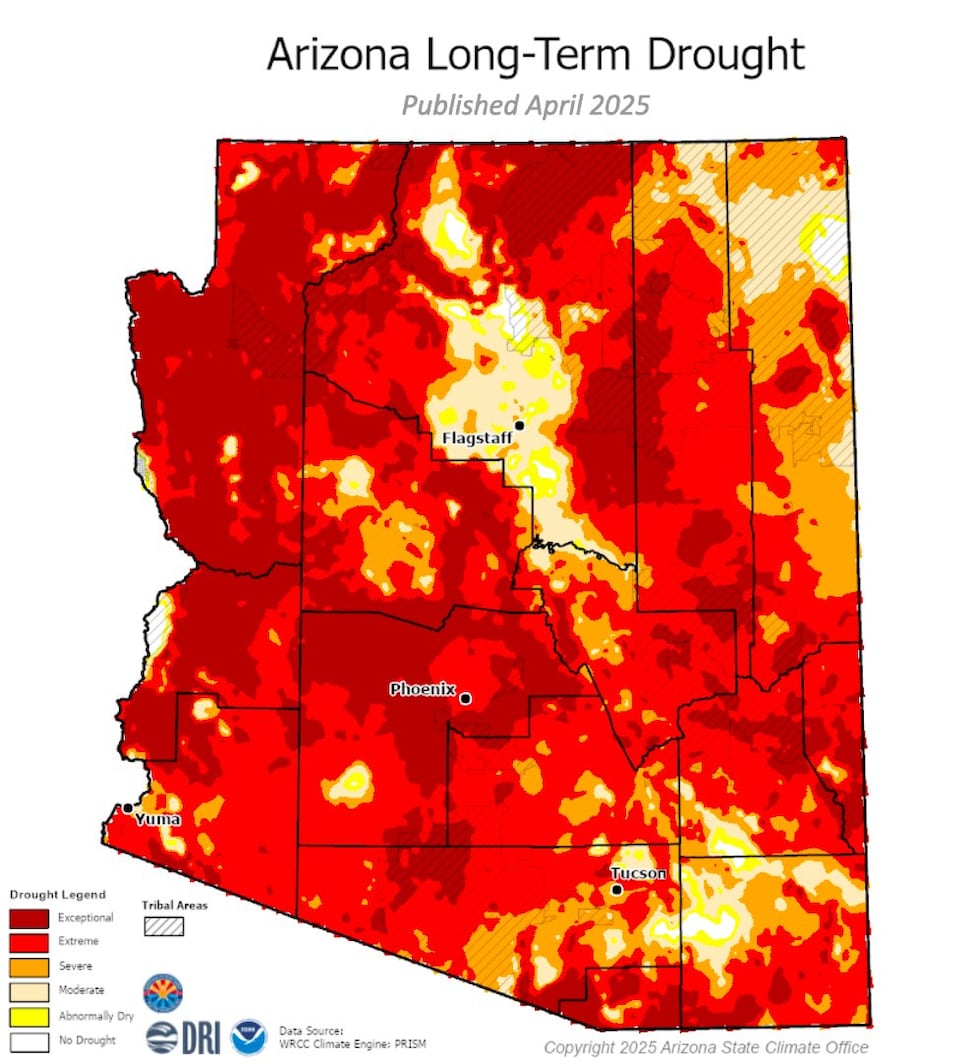
In simple terms, this map shows the extent of the drought over the past five years. Specifically, it uses historical streamflow and precipitation data from April 2020 to March 2025 and then compares that to historical averages. The stretch over the past five years is the fourth driest on record.
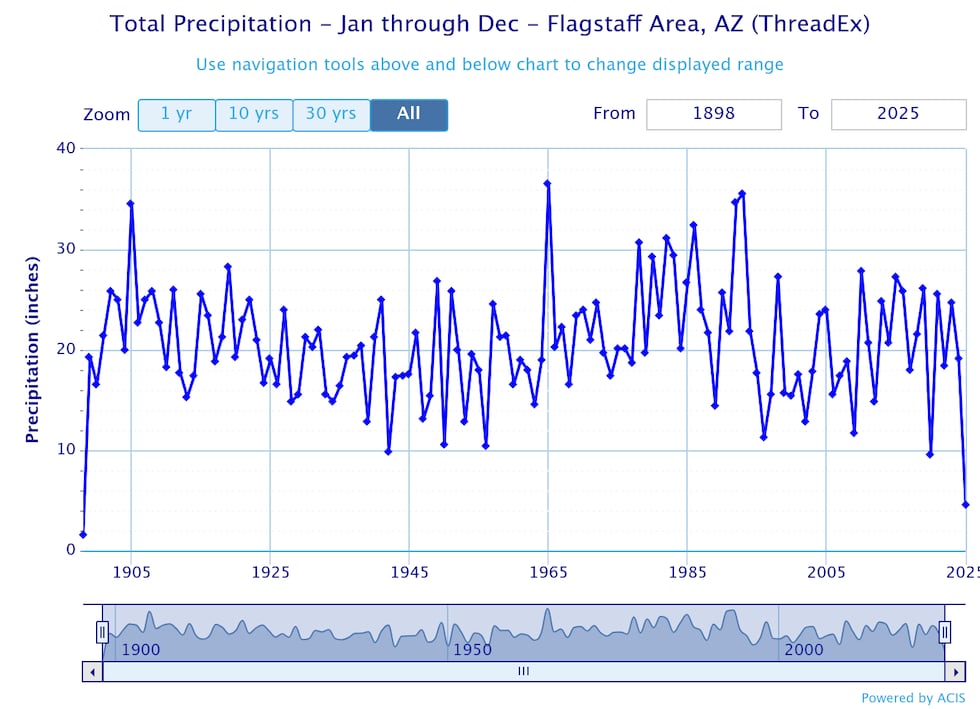
Notice that much of Maricopa County is covered by “exceptional drought” and “extreme drought.” It is interesting to see that a decent part of Coconino County, including the Flagstaff area, is in the moderate category. This is likely partly due to the fact that Flagstaff had decent to above-average moisture from 2021 to 2024.
Keeping track of short-term rainfall trends, such as the past week or month, is still important. However, long-term trends add a bit more perspective. The map at the top of this discussion tells us that, for most of Arizona, we have a big hole to climb out of to make significant dents in the long-term drought.
We are fortunate that March was fairly close to normal for precipitation in Arizona and even above normal in some parts of the state. However, it will take many additional above-normal months to make up for the long-term water deficit.
See a spelling or grammatical error in our story? Please click here to report it.
Do you have a photo or video of a breaking news story? Send it to us here with a brief description.
Copyright 2025 KTVK/KPHO. All rights reserved.


